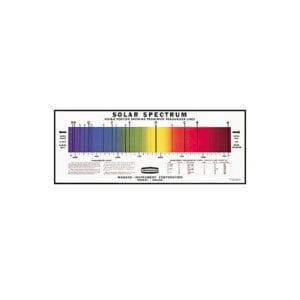
CHART (pH Colour]: Polyart plastic sheet
Classroom size dimensions: 750mm x 1000mm shows 11x colour changes. Printed on polyart plastic sheet, coloured, fitted with plastic roller.
For other Chart options, click here.

$ 22.50 excl. GST
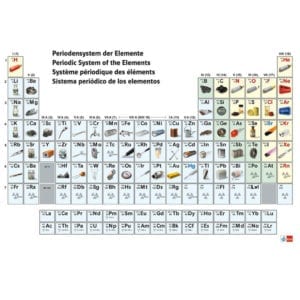
Classroom size dimensions: 750mm x 1000mm shows 11x colour changes. Printed on polyart plastic sheet, coloured, fitted with plastic roller.
For other Chart options, click here.
OUT OF STOCK. Can be backordered.
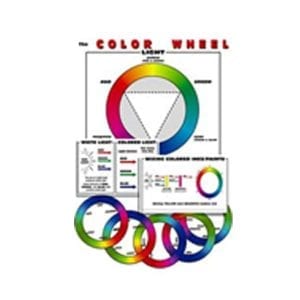
Classroom size dimensions: 750mm x 1000mm shows 11x colour changes. Printed on polyart plastic sheet, coloured, fitted with plastic roller.
For other Chart options, click here.
| Description |
|---|