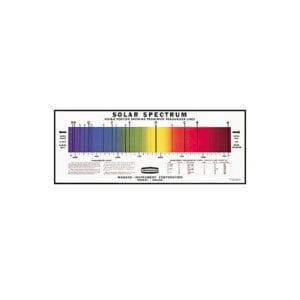
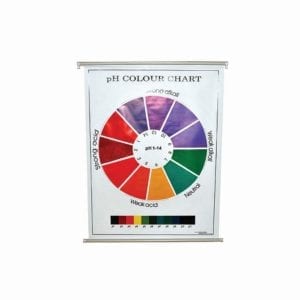
CHART [Colour Wheel]: Glossy paper
Glossy paper 0.12mm thick – 460mm x 1000mm.
For other Chart options, click here.

$ 32.95 excl. GST
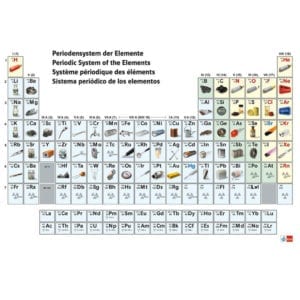
Glossy paper 0.12mm thick – 460mm x 1000mm.
For other Chart options, click here.
In stock (can be backordered)
Glossy paper 0.12mm thick – 460mm x 1000mm.
For other Chart options, click here.